Every year the Council is required to provide an annual status report covering its Air Quality Management Areas (AQMA) in the City Centre and in Gosforth. Figures have just been released for 2016 and, contrary to the longer term trend, there were significant increases in pollution across many sites in Gosforth and in the City Centre.
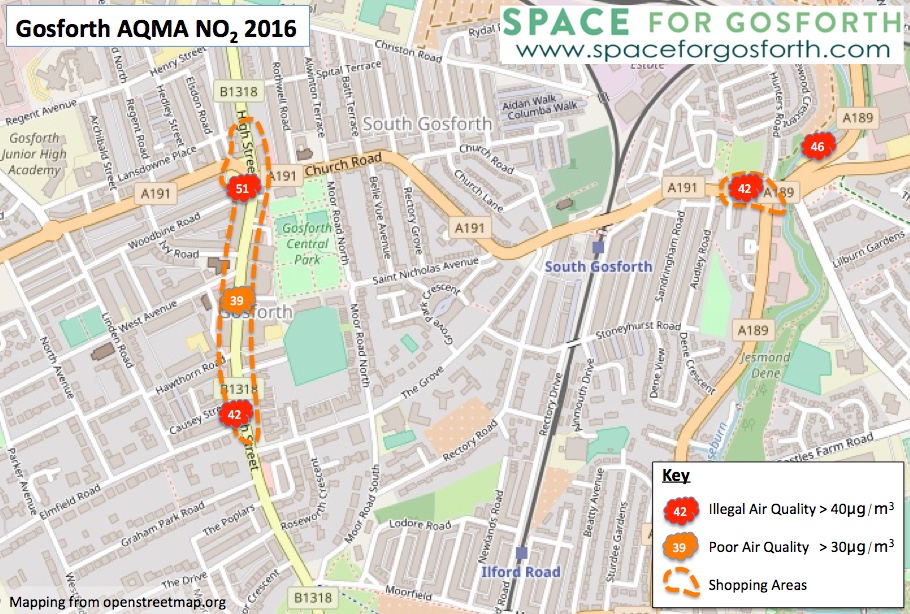
In Gosforth, whereas in 2015 all measurements for Nitrogen Dioxide (NO2) were under the maximum legal level of 40 micrograms per cubic metre (μg/m3), in 2016 four of the monitors showed illegal levels of NO2 air pollution. Two of these were on Gosforth High Street and two at Haddricks Mill junction. It is possible that some of the increase on Gosforth High Street related to the road works to re-design Salters Road junction. However, given the increases in other locations, it feels likely that even without the roadworks there would have been an increase.
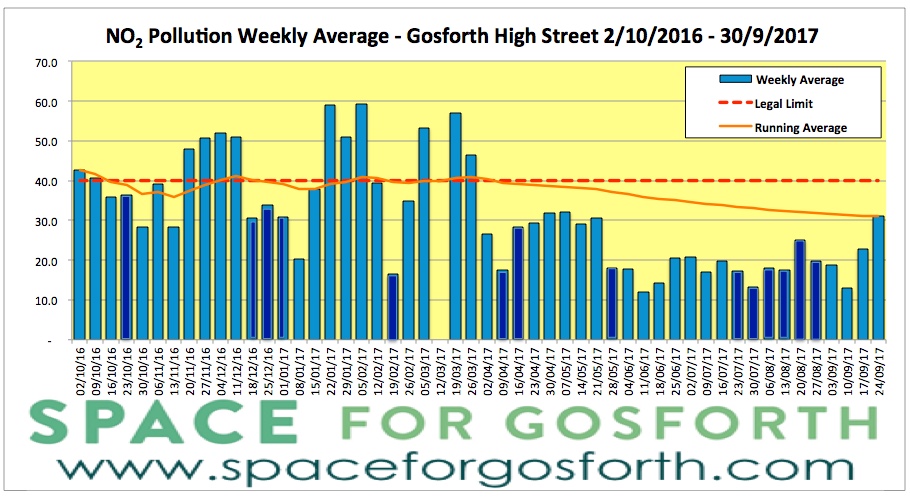
We also have more recent figures since completion of the road works thanks to the Newcastle Urban Observatory, which also has a monitor at Salters Road junction. The graph below shows average pollution levels by week over the year showing higher levels over winter, with lower levels from the start of April. The darker coloured bars show the weeks that were local school holidays.
The annual average at Salters Road junction in this period from October 2016-September 2017, according to these unofficial figures, would be about 30 μg/m3. We will have to wait until the official 2017 figures however to see if this pattern is validated by the official monitoring sites.
Arriva North East introduced newer Sapphire buses on a number of services using Gosforth High Street in August 2017 so possibly that will have a beneficial effect even if the new buses are still only Euro 4 and Euro 5 standard for emissions.
Newcastle City Centre
In the city centre, NO2 levels were above the legal limit in all areas from St James’ Park to the Civic Centre and the Quayside. Particularly high values were recorded by Haymarket and at Swan House roundabout. 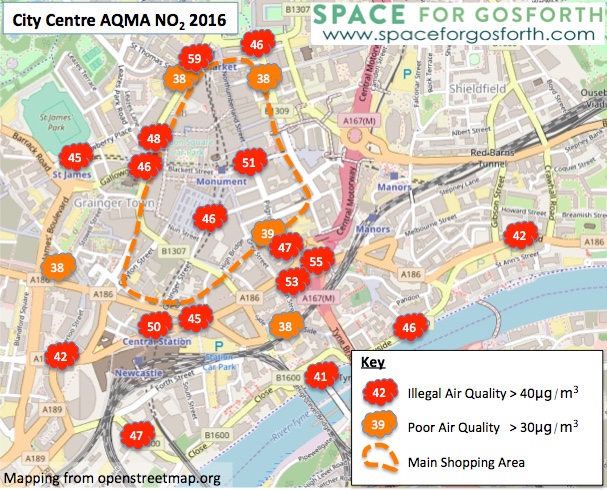
Clean Air “In the Shortest Possible Timescales”
Following the publication of the Government’s Air Quality Plan in July 2017, local authorities have been directed to create their own draft plan to achieve legal limits within the shortest possible time by March 2018.
The Council is currently undertaking a joint study with Gateshead Metropolitan Borough and North Tyneside councils to identify options for meeting the legal limits. This includes the areas identified by DEFRA (The Tyne Bridge, the A1 and the Coast Road) as well as the city centre. Possibly with the above results Gosforth also now needs to be included in that plan.
In the Council Cabinet briefing paper (item 6) which describes the study it confirms that “If Local Authorities do not take action to reduce exposure to air pollution below limit values, there is a potential for infraction fines to be passed to the local authority by the Government utilising the Localism Act.“
The direction to achieve compliance in the shortest possible timescales comes not just from the Government’s plan but also from a High Court ruling, which also clarified that the plan to bring air pollution within legal levels cannot be delayed as a result of economic considerations.
The Government’s analysis shows that “road transport is responsible for some 80% of NOx concentrations at roadside” and so any plan to reduce air pollution will have to include some element of limiting or discouraging vehicles. This could be by closing roads to prevent unnecessary through traffic or financial measures like congestion charging or parking fees.
This is already happening in some UK cities e.g. in Oxford they have “plans to start phasing out polluting vehicles including taxis, cars and buses from city centre area in 2020” and Nottingham City Council have introduced a Workplace Parking Levy which has helped fund public transport and improve air quality. As we shared in our blog The New Newcastle Air Pollution Plan, it is possible the current Alive After Five subsidised car parking initiative is not compliant with the legal ruling to achieve compliance with air quality targets.
Reducing Traffic
Over the last year we have been able to see what an impact reducing traffic levels can have, even if only for a short period.
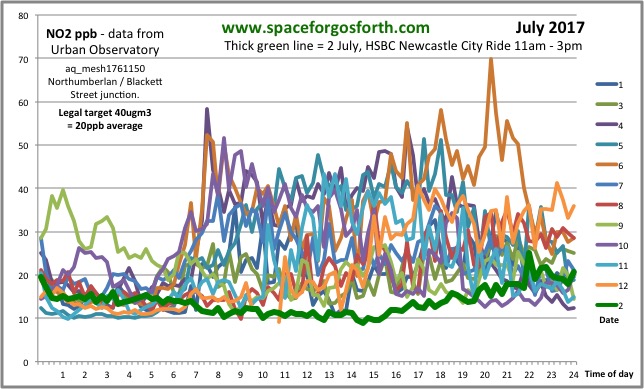
On 2 July 2017 parts of the city centre were closed for a British Cycling Let’s Ride event. Part of the route for the day passed one of the Urban Observatory‘s monitors at the junction of Northumberland and Blackett Street. The graph below shows that air quality on 2 July was much better than any other day in July and also therefore how legal compliance can be achieved almost instantly by reducing traffic levels.
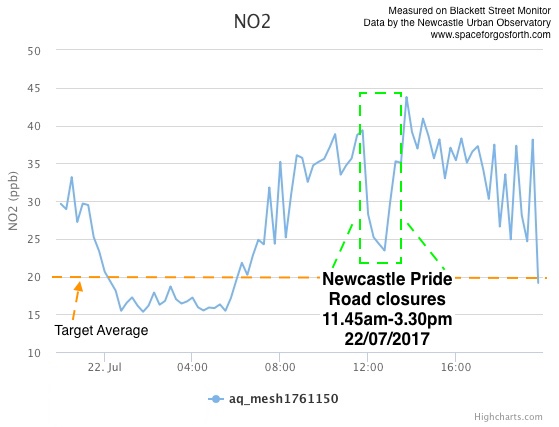
Later in July there was a further brief road closure for the Northern Pride march, which even though lasting only a few hours caused air pollution to improve significantly in that short period.
Newcastle’s two Air Quality Management Areas will be 10 years old in April 2018. Many children growing up in Newcastle and in Gosforth may have spent their entire lives living in or near Air Quality Management Areas.
The approaches used to date have been shown to be too slow or ineffective. To achieve compliance in the shortest possible timescales real commitments are required to effect a step change so that the city can be rid of dangerous air quality levels it has suffered for too long.

