This is SPACE for Gosforth’s seventh annual pollution blog covering official air quality monitoring in Newcastle upon Tyne. In all seven years, air pollution in Newcastle has exceeded legal limits.
The main pollutant of concern in Newcastle is Nitrogen Dioxide (NO2). The legal maximum for NO2 is 40μg/m3 (micro grams per cubic metre) averaged over a calendar year. In 2022, the highest reading was 92μg/m3, over double the limit. The World Health Organisation (WHO) recommend NO2 should be no more than 10μg/m3 averaged over a year.
2022 Highlights:
- With no Clean Air Zone (originally planned for January 2020) air pollution in Newcastle still didn’t meet UK legal limits.
- Haymarket was the most polluted location in the city centre.
- The worst pollution recorded across all Newcastle was 92μg/m3 on The Coast Road by the junction with Jesmond Park West, the same location as 2021.
- Measurements from Gosforth were all within UK legal limits for the third year running, though still substantially higher than the WHO’s recommended maximum.
For anyone thinking that there must be a better way to cut air pollution than a Clean Air Zone, the Council’s city centre Air Quality Plan, in place since 2008, has 38 non-CAZ actions to improve air quality. This isn’t specific to Newcastle, most local authorities with Air Quality Management Areas (AQMAs) have had similarly ineffective plans. If these other measures were effective, pollution would already be well below legal limits.
Newcastle City Centre
In the city centre, Haymarket was the most polluted with a Nitrogen Dioxide (NO2) reading of 53μg/m3, a slight increase on 2021 and substantially above both the 40μg/m3 legal maximum for the UK and the WHO recommendation.
Strawberry Place, which was the most polluted location in 2021 with 54μg/m3, recorded 46.4μg/m3 in 2022.

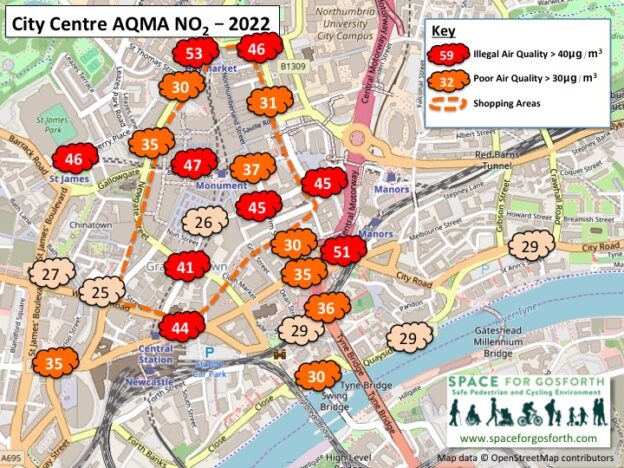
City Centre Air Quality Management Area (AQMA)
These are the city centre locations where air pollution exceeded the legal limit in 2022
- 53.3 μg/m3 DT29/DT30/DT31 (triplicate co-location site, Percy Street)
- 50.5 μg/m3 DT12/Dt117/DT118 (8 Mosley Street)
- 48.9 μg/m3 DT81 (Stephenson Road)
- 46.6 μg/m3 DT65 (Blackett Street/Old Eldon Square)
- 46.4 μg/m3 DT128 (Strawberry Place)
- 46.3μg/m3 St Marys Place/John Dobson Street (DT5, DT115,DT116)
- 45.1 μg/m3 DT102 (John Dobson Street)
- 44.7 μg/m3 DT8 (Market Street)
- 43.5 μg/m3 DT13 (Neville Street/Westgate Road)
In most cases readings were very similar to 2021.
In 2019 (pre-Covid), Blackett Street was the most polluted location in the city centre with a measurement of 71μg/m3. Also higher in 2019 were Central Station (69μg/m3), Haymarket (66μg/m3) and Grainger Street (65μg/m3).
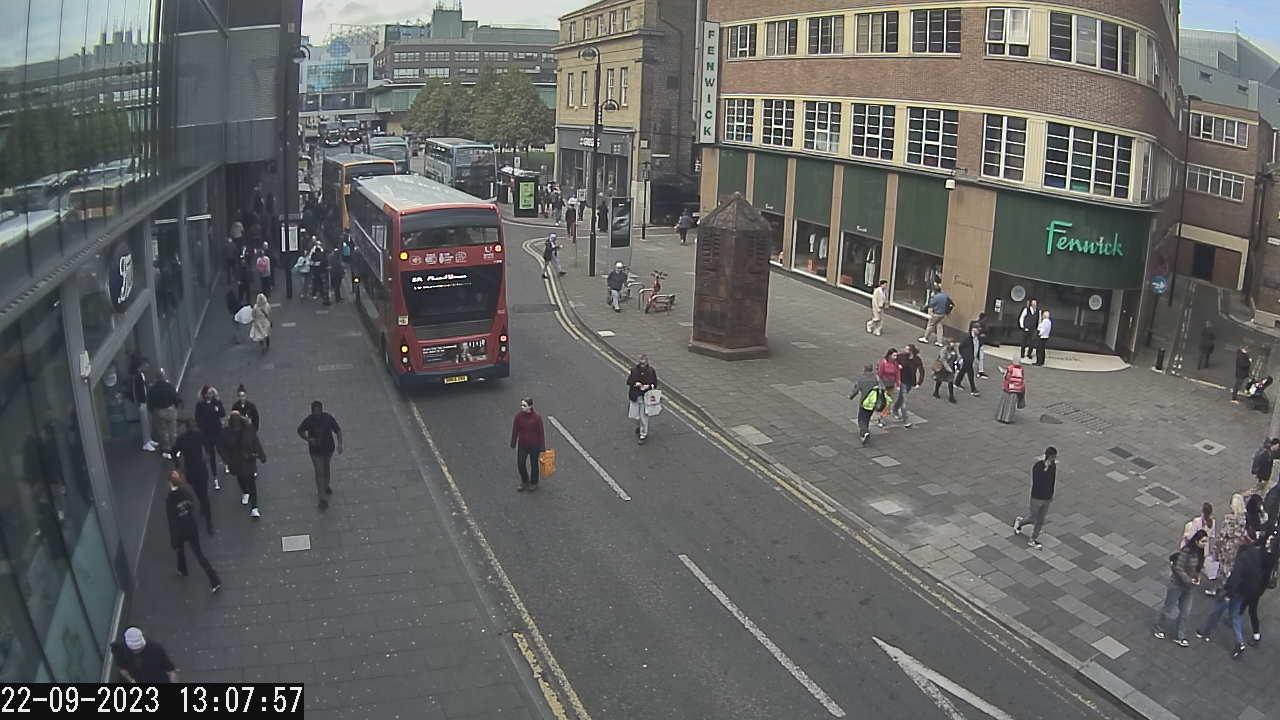
Air pollution on Blackett Street in 2022, including from buses, was above the legal limit, measured at 47μg/m3.
PM2.5, very small particulate matter pollution, is also measured in the city centre at the Civic Centre. In 2022 the reading was 6.5μg/m3 (down from 7.1μg/m3 in 2021) which is less than the UK Legal limit 20μg/m3, but higher than WHO guidance that the annual average should be no more than 5μg/m3.
Central Motorway and Coast Road
The Council’s pollution plan analysis from 2019 was that air quality on The Coast Road would be compliant in 2021 and that no additional measures would be required. Clearly that hasn’t worked out as two locations were still above legal limits in 2022, one substantially so (almost 2.5 times the limits).
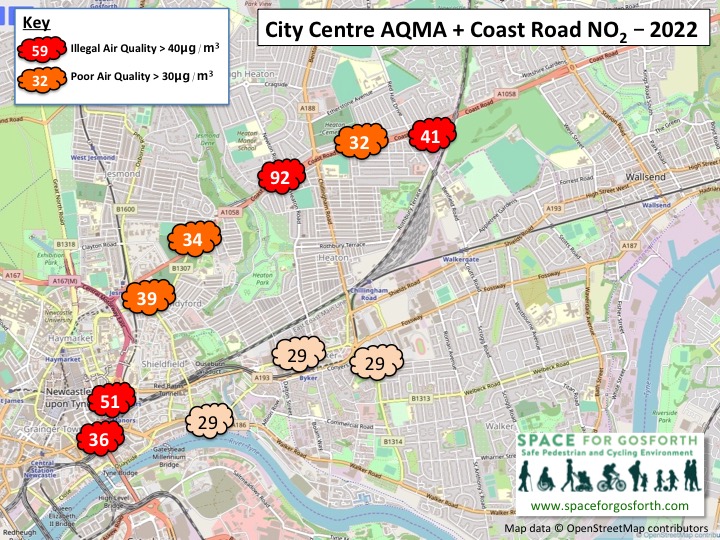
City Centre AQMA and Coast Road NO2 in 2022
These are The Coast Road locations where air pollution exceeded the legal limit in 2022
- 92.2 μg/m3, DT81 (Stephenson Road, entrance to Jesmond Park West)
- 41.4μg/m3, DT84 (A1058 Coast Road, Wills Building)
This is the combined result of about 50,000 vehicles using this route every day in 2022.
Drivers and car passengers who use this route every day will continue to expose themselves to significant levels of pollution, especially as the concentration of pollution within vehicles is typically much higher than the air outside.
Gosforth
In 2022, all Gosforth High Street monitors recorded pollution levels within legal limits, again debunking irresponsible scaremongering claims of “significantly more toxic fumes” due to the High Street Covid scheme which was replaced in March 2023.
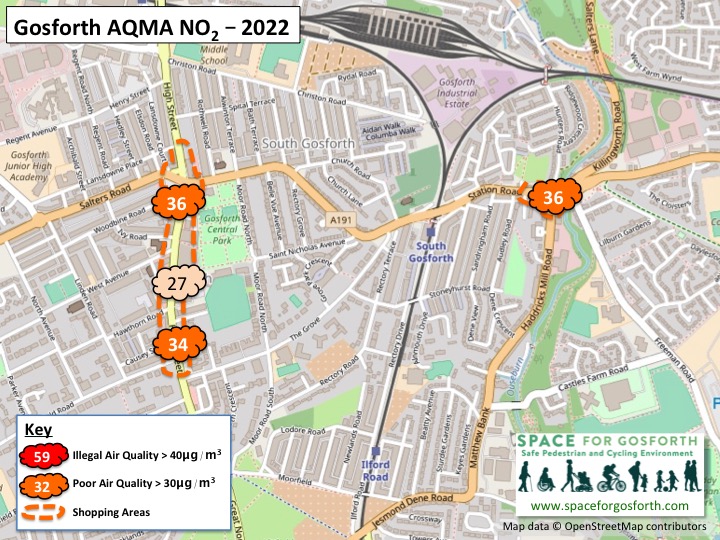
Gosforth Air Quality Management Area (AQMA)
The four pollution measurements shown in Gosforth (all within UK legal limits) are:
- 35.5μg/m3, DT50 (84 Station Road)
- 33.8μg/m3, DT43 (53 High Street, Gosforth)
- 27.3μg/m3, DT44 (102 – 104 High Street, Gosforth)
- 36.4μg/m3, DT45 (201 Gosforth High St)
Unless traffic dramatically increases again on Gosforth High Street it is likely pollution readings will now remain within UK legal limits, although still much higher than WHO recommended levels.
The graph below shows that air pollution at the three High Street monitoring sites and average daily traffic measured just north of The Grove are clearly linked. Because of this, doing anything that increases vehicle capacity on Gosforth High Street would potentially be in violation of the Air Quality Regulations.
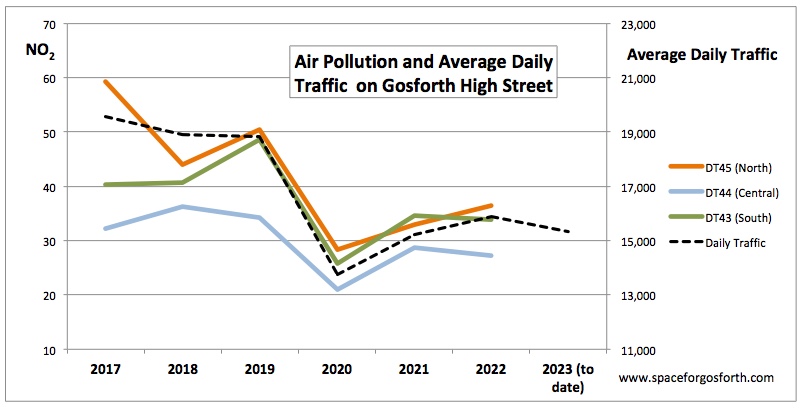
Air pollution and average daily traffic on Gosforth High Street
Average daily traffic in 2023, up to the end of July, is still less than 16,000 vehicles a day so pollution in 2023 is likely to remain under the UK legal limit.
Air pollution at Haddricks Mill, 35.5μg/m3 in 2022, is broadly unchanged from previous years.
Denton Burn
Other than Cowgate, all the readings west of the city were also within legal limits.
The A1 Scotswood to North Brunton road widening was completed 10 October 2022. The average measurements at Cowgate in November / December 2022 following completion were > 50μg/m3 so there is a risk that pollution levels will have increased here in 2023 due to induced demand from the additional capacity on the A1.
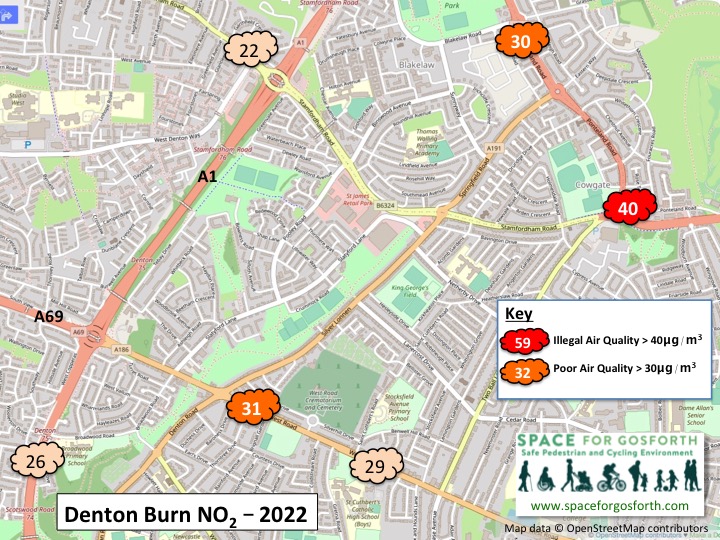
Denton Burn air pollution readings
The Clean Air Zone
The Clean Air Zone (CAZ) came into force from January 2023, so it is possible that next year we might finally have some good news – eighteen years after UK Air Quality Limits should have been met in Newcastle!
This Government’s Air Quality Technical Guidance states that charging the most polluting vehicles is one of the most effective ways to reduce pollution, so the CAZ is likely to be effective to cut pollution in the city centre.
Cleaner buses, taxis, vans and HGVs will also benefit roads outside the city centre, but we don’t know whether that will be sufficient for air quality, for example on Central Motorway, Cowgate or The Coast Road.
The table below shows the split of traffic on The Coast Road, St James’ Boulevard, Tyne Bridge and Gosforth High Street in 2022. As it shows, Gosforth High Street has the highest proportion of buses, HGVs and heavy vans so is likely to gain the most. Coast Road traffic is only 7% buses, HGVs or heavy vans so may not benefit as much.
| Location | Cars* | Heavy Vans | Buses & HGVs |
| Coast Road | 93% | 6% | 1% |
| St James’ Boulevard | 91% | 8% | 1% |
| Tyne Bridge | 93% | 4% | 2% |
| Gosforth High Street | 88% | 6% | 6% |
* “cars” includes taxis and light vans.
We hope the Council will be able to release air pollution monitoring data sooner in future, so that we can find out quickly what impact the CAZ has had.
SPACE for Gosforth has previously summarised official air pollution measurements for 2021, 2020, 2019, 2018, 2017 and 2016.